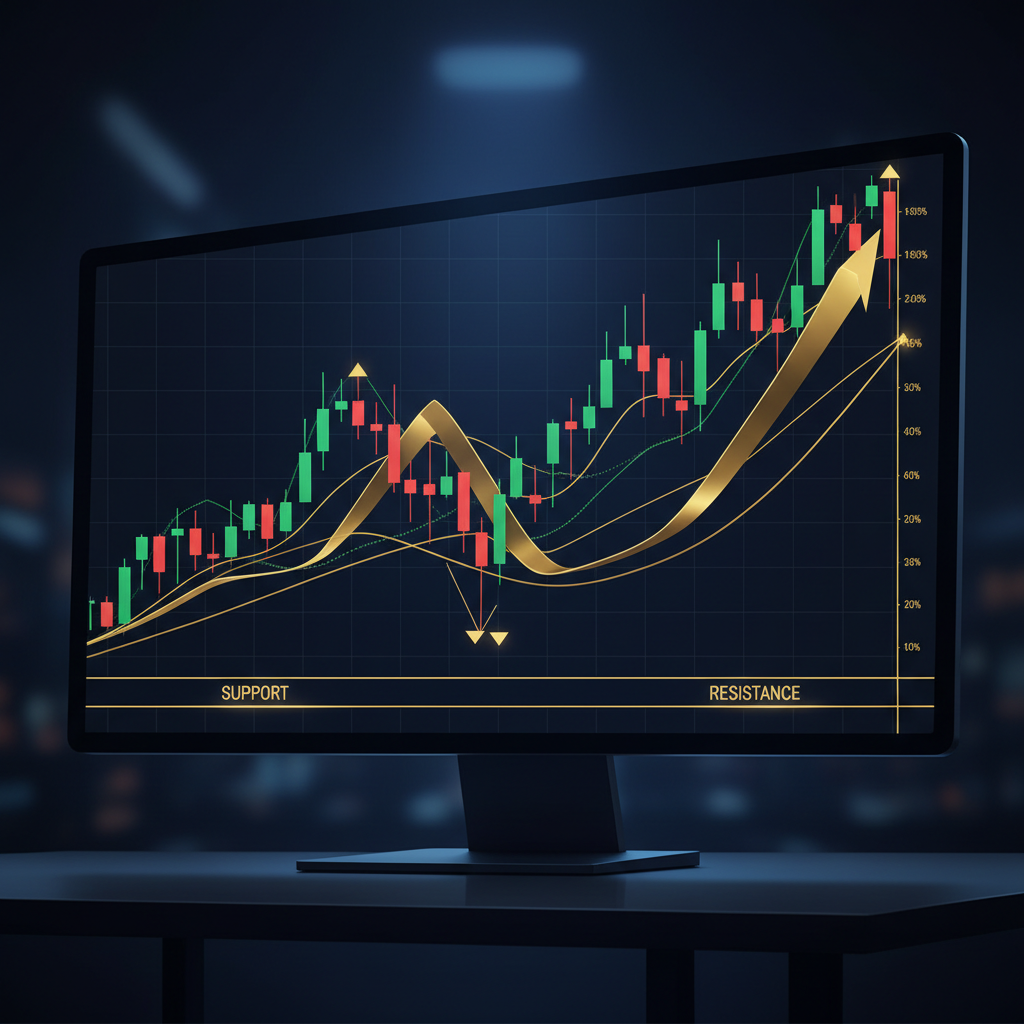

The Power of Technical Analysis Explained
Technical analysis is the study of price charts to predict future movements. It is not a crystal ball — it is the reading of market psychology.
What Is Technical Analysis?
Technical analysis assumes that all known information is already reflected in the price. Therefore, it focuses on the price itself: patterns, trends, and levels.
The core idea: price behavior repeats itself because human psychology repeats itself.
The Three Pillars
1. Price Discounts Everything
Everything that moves the market — news, economy, sentiment — is already priced in. You don't need to analyze the news; the price tells you what the market thinks.
2. Price Moves in Trends
Markets usually trend — up, down, or sideways. It is easier to trade with the trend than against it.
'Speak with the trend, and the trend speaks back to you. Go against the trend, and the trend silences you.'
3. History Repeats Itself
Patterns that worked 100 years ago still work today. Why? Because people remain people — fear and greed do not change.
The Key Components
Trend Lines
A trend line connects consecutive higher lows (upward trend) or lower highs (downward trend). The trend line acts as dynamic support or resistance.
Support and Resistance
Support is a price level where the price struggles to fall below. Resistance is where the price struggles to rise above. These levels occur because buyers and sellers gather there.
Candlesticks
Candlesticks show the open, high, low, and close price of a period. Patterns in candlesticks can reveal sentiment shifts.
Moving Averages
Moving averages smooth price data to make the underlying trend visible. The 50 and 200-period moving averages are commonly used.
Volume
Volume confirms movements. A breakout on high volume is more reliable than a breakout on low volume.
What Technical Analysis Is Not
- No magic — it doesn't always work
- Not a substitute for risk management
- No guarantee of profit
It is a tool, not a crystal ball.
Conclusion
Technical analysis provides you with a framework to understand the market. It does not tell you what will happen — it tells you what is likely to happen. And that is enough to have an edge.
The key is consistency: use the same tools, the same timeframes, and the same rules every time.