Moving Averages: The Ultimate Guide
Moving averages are among the most widely used indicators in the world. They are simple but powerful if you know how to use them correctly.
What Is a Moving Average?
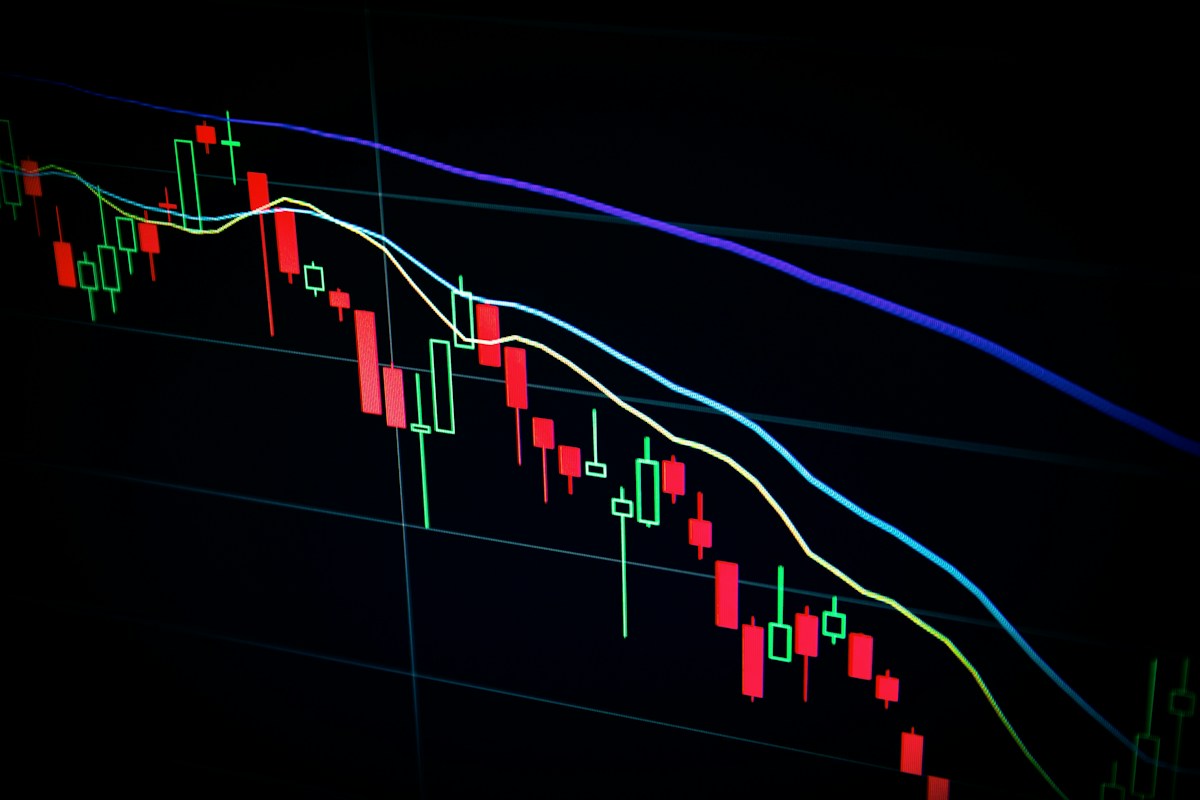
A moving average (MA) calculates the average of a specific number of periods. It smooths out price data, making it easier to see the underlying trend.
Types of Moving Averages
Simple Moving Average (SMA)
The SMA gives equal weight to each period. It is the most standard form, but it can be slow to react to recent price movements.
Exponential Moving Average (EMA)
The EMA gives more weight to recent prices, allowing it to respond faster to new information. Most professional traders prefer the EMA.
The Most Common Periods
- 9 or 12 EMA: For short-term momentum
- 20 or 21 EMA: The standard for day traders
- 50 SMA: For medium-term trend
- 200 SMA: The gold standard for the long-term trend
Strategies with Moving Averages
The Golden Cross
When the 50 SMA rises above the 200 SMA, this is known as a golden cross. It is a powerful bullish signal.
The Death Cross
The opposite: when the 50 SMA falls below the 200 SMA. This is a bearish signal.
Dynamic Support and Resistance
Moving averages often act as dynamic support or resistance. The 200 SMA is particularly powerful in this regard.
Common Mistakes
The biggest mistake is using moving averages as a standalone signal. They are trend-following and perform poorly in sideways markets. Always use them in combination with other tools.