
The Power of Technical Analysis Explained
Technical analysis is dismissed by some as 'reading charts'. But it is much more than that. It is the study of collective human behavior, captured in price movements.
What Is Technical Analysis?
Technical analysis is the study of price charts to recognize patterns that can help predict where the price is headed. It is based on three basic principles:
- The price contains all information: Everything that affects the market is already reflected in the price.
- Prices move in trends: Markets tend to move in one direction.
- History repeats itself: Human psychology doesn’t change, so patterns repeat.
The Key Tools
Candlesticks
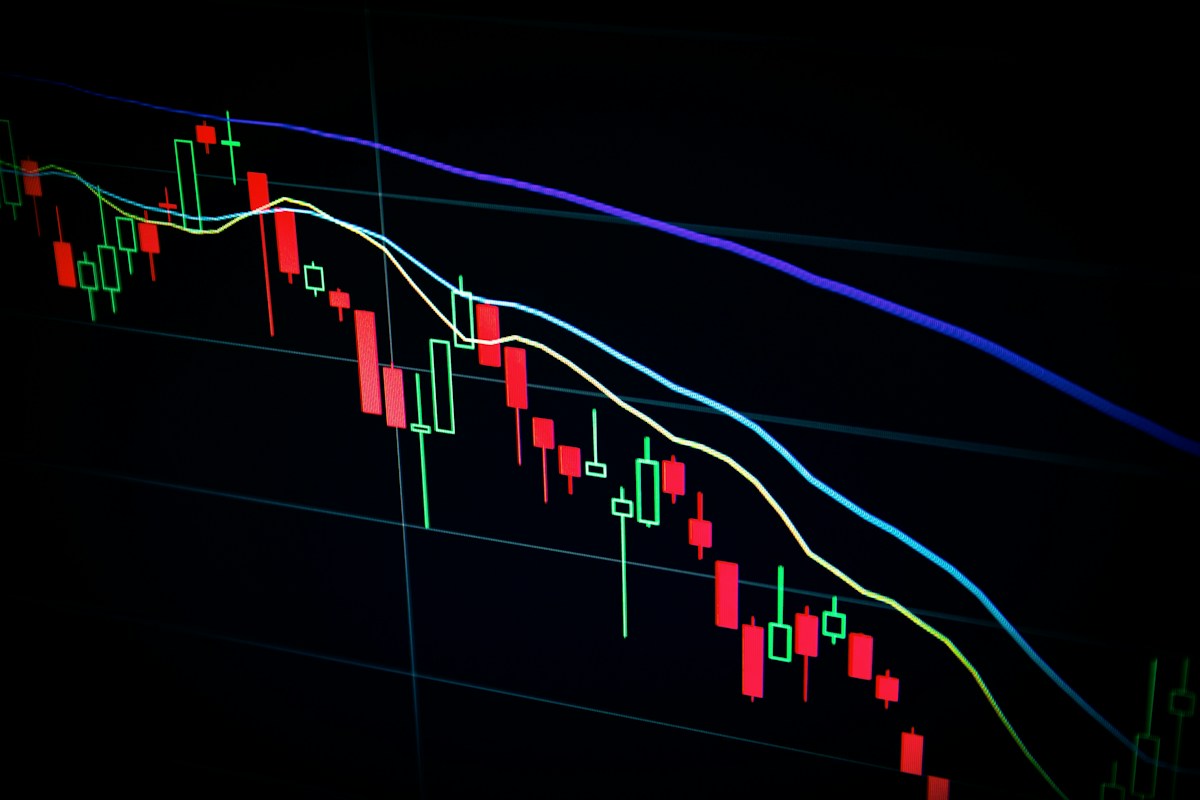
Candlesticks are the most detailed way to display price data. They show the open, close, high, and low of each period.
Trend Lines
Trend lines connect significant highs or lows. They help you see the direction of the trend.
Support and Resistance
Levels where the price previously struggled or reversed. They act as invisible barriers.
Indicators
Mathematical calculations based on price and volume. Think of Moving Averages, RSI, MACD, and Bollinger Bands.
Pattern Recognition
Specific formations in the chart that have predictive value. Consider head and shoulders, double tops, and triangles.
Why It Works
Technical analysis does not work because it predicts the future. It works because it makes human behavior visible.
When the price approaches a support level, traders remember that the price reversed here before. They buy, and thus the price indeed reverses. It’s a self-fulfilling prophecy.
How to Apply It
Multiple Timeframes
Always look at multiple timeframes. The big trend on the daily chart is more important than the fluctuations on the 5-minute chart.
Confirmation
Wait for confirmation. One signal is not enough. Look for multiple signals that point in the same direction.
Simplicity over Complexity
More indicators do not mean better analysis. Keep it simple and focus on what works for you.
Combine With Fundamental Analysis
Technical tells you when. Fundamental tells you why. Together they are stronger than alone.
Common Mistakes
Too Many Indicators
A chart with 10 indicators is unreadable. Choose 2-3 and get to know them well.
Worrying About Every Small Movement
Not every fluctuation is a signal. Focus on the big patterns.
Forgetting the Context
Technical analysis in a vacuum is useless. What is the economic news? What is the bigger trend?
Overconfidence After a Winner
One good prediction doesn’t make you an expert. Stay humble and readable.
Conclusion
Technical analysis is a powerful tool, but it is not a magic ball. It requires study, practice, and discipline. But once you master it, you will have an advantage over most traders who act without a plan.