Drawing Trend Lines: A Complete Guide
Trend lines are perhaps the most accessible tool in technical analysis. Anyone can draw them, but not everyone draws them correctly. Here’s how to do it right.
What Is A Trend Line?
A trend line is a straight line that connects two or more significant points on a chart. It helps you see the direction of the trend and identify potential turning points.
How To Draw A Trend Line
In An Upward Trend
- Find the lowest point (trough) of the trend
- Find the next higher low
- Draw a line through these two points
- The line should slope upwards
In A Downward Trend
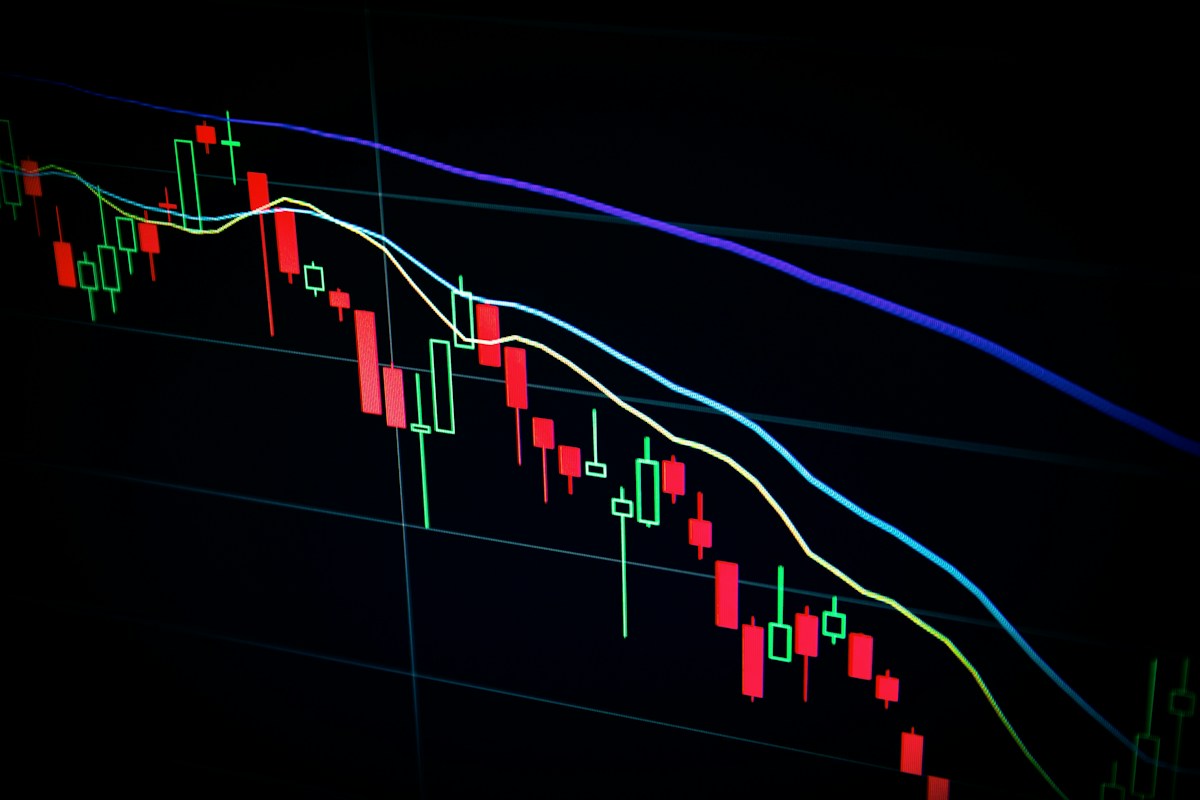
- Find the highest point (peak) of the trend
- Find the next lower high
- Draw a line through these two points
- The line should slope downwards
Important Rules
At Least Two Points
You need at least two points to draw a trend line. But only with three or more touchpoints does the line become reliable.
Don't Force It
If the points don’t line up neatly, don’t force it. A bad trend line is worse than having no trend line at all.
Multiple Timeframes
What is visible on a higher timeframe carries more weight. A trend line on the daily chart is more important than a trend line on the 15-minute chart.
How To Use Trend Lines
As Support Or Resistance
In an upward trend, the trend line acts as dynamic support. When the price touches the line, it may be a buying opportunity.
Breakout Trading
When the price breaks through the trend line, it can signal that the trend is reversing. This can be a sell signal.
Trend Channel
Draw a parallel line at the top of the trend. This creates a channel within which the price moves.
Common Mistakes
Too Tight
A trend line doesn't need to touch every point exactly. Give the market some breathing room.
Too Few Points
One touchpoint is not a trend line. Wait until you have at least two confirmed points.
Old Trends
A trend line that is months old may be irrelevant. Update your trend lines as the market evolves.
Conclusion
Trend lines are simple yet powerful. With some practice, you can use them to identify trends, find support and resistance, and make better trading decisions.